Data
30 second recordings across three blocks and four levels informs us of the lack of activity within Lasalle.

Introduction
To get a good sample of sound, I recorded each location for approximately 20 to 30 seconds. I then placed these recordings into code to sieve out the amplitude levels. Amplitude is measured between 0 to 1, with intervals spanning as many as three decimal places (e.g. 0.001). The purpose for my recording was to compare the sound from different parts of school, so I stuck to two parameters for comparison—amplitude and location. With only two parameters, the easiest type of visual data would be in the form of a graph.
Data Visualisation
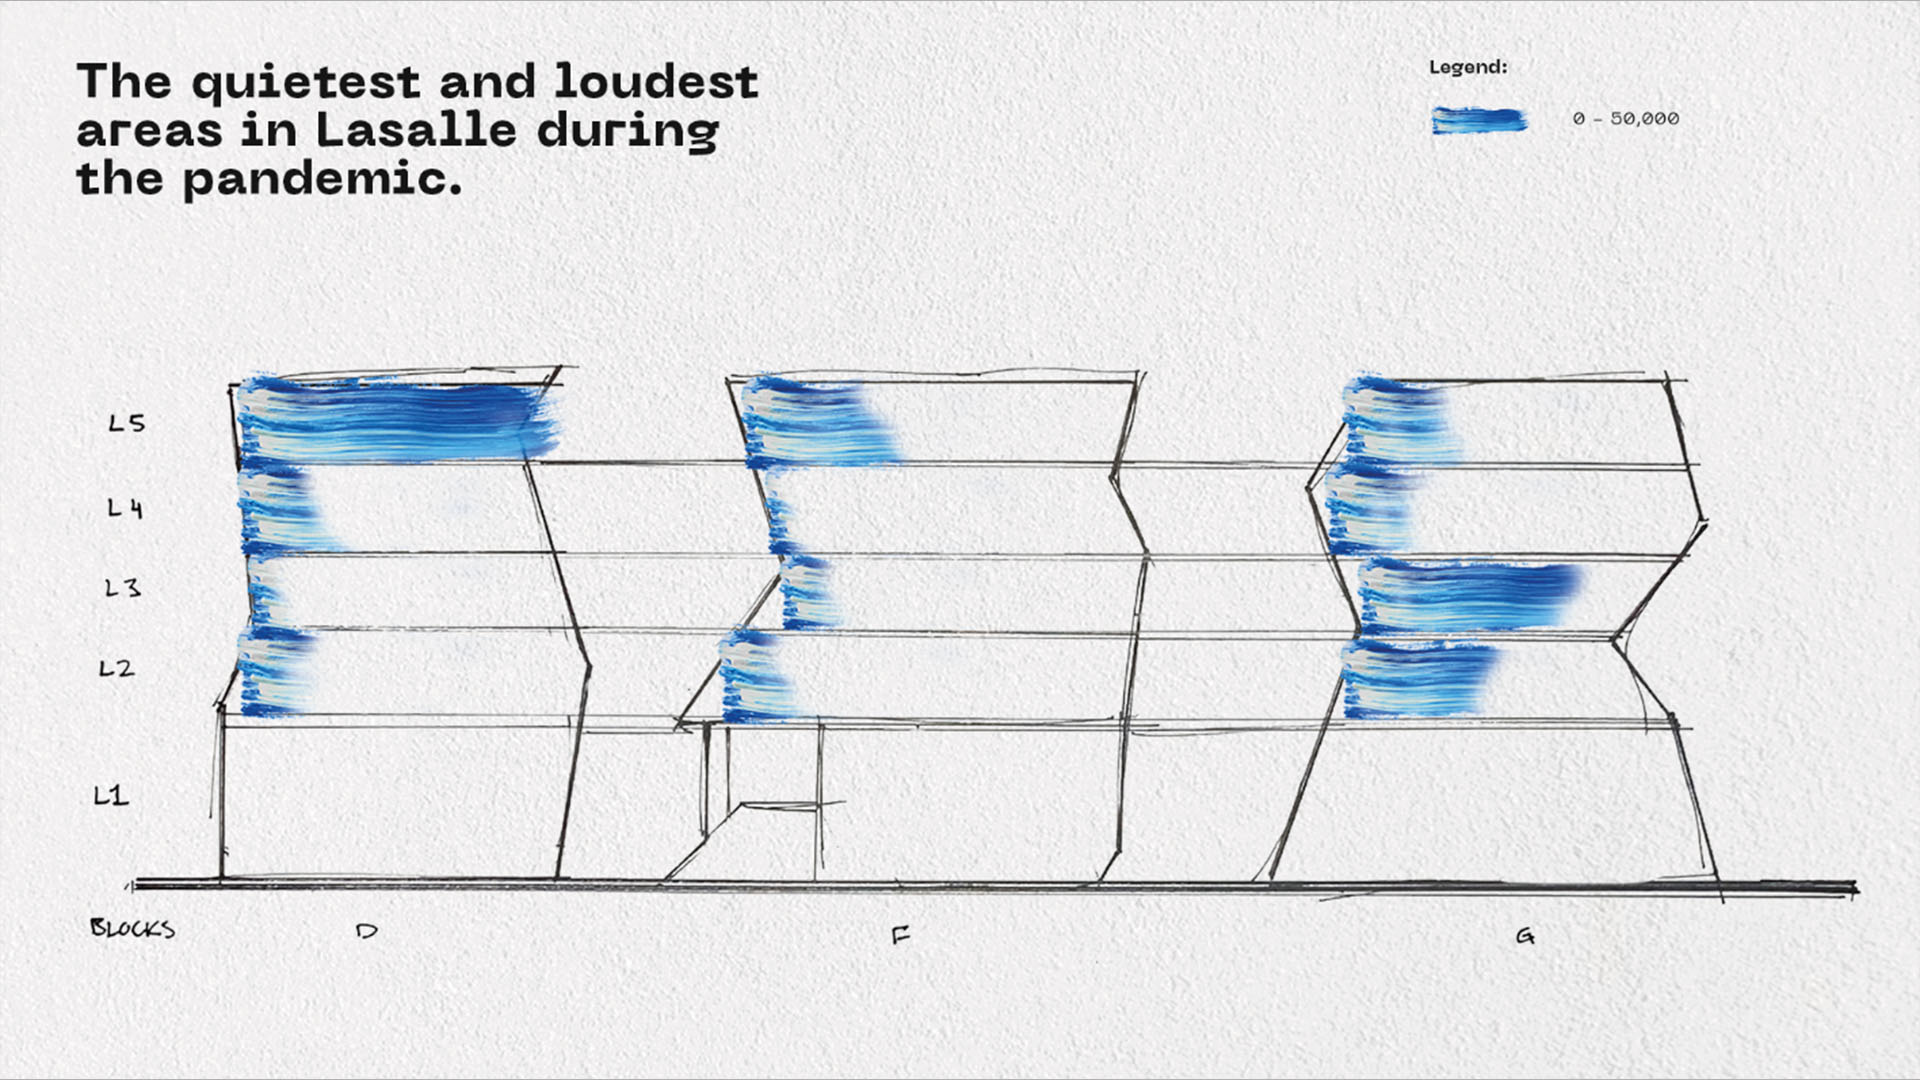
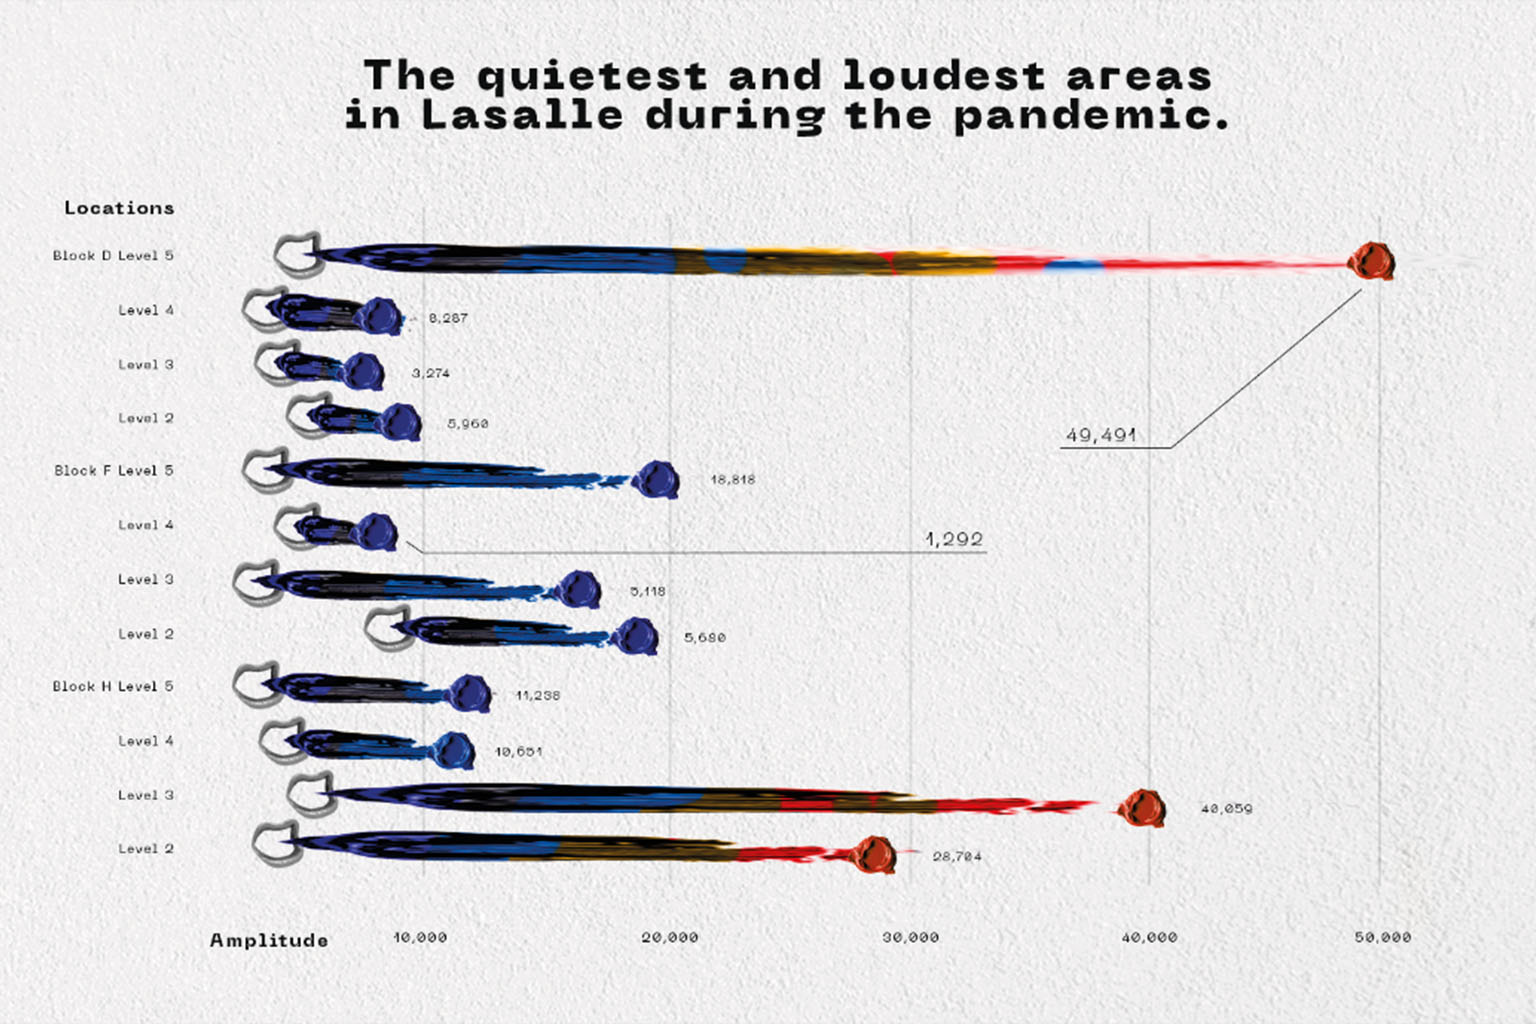
The bar graph was chosen for its ease of understanding and purpose in visualising my data. Bar graphs allow us to compare multiple headers to a single common denominator (i.e. amplitude levels). At first glance, drawing out the bars will create an immediate understanding that Block D Level 5 was the loudest location. It also helps that the bars may be represented as a building.
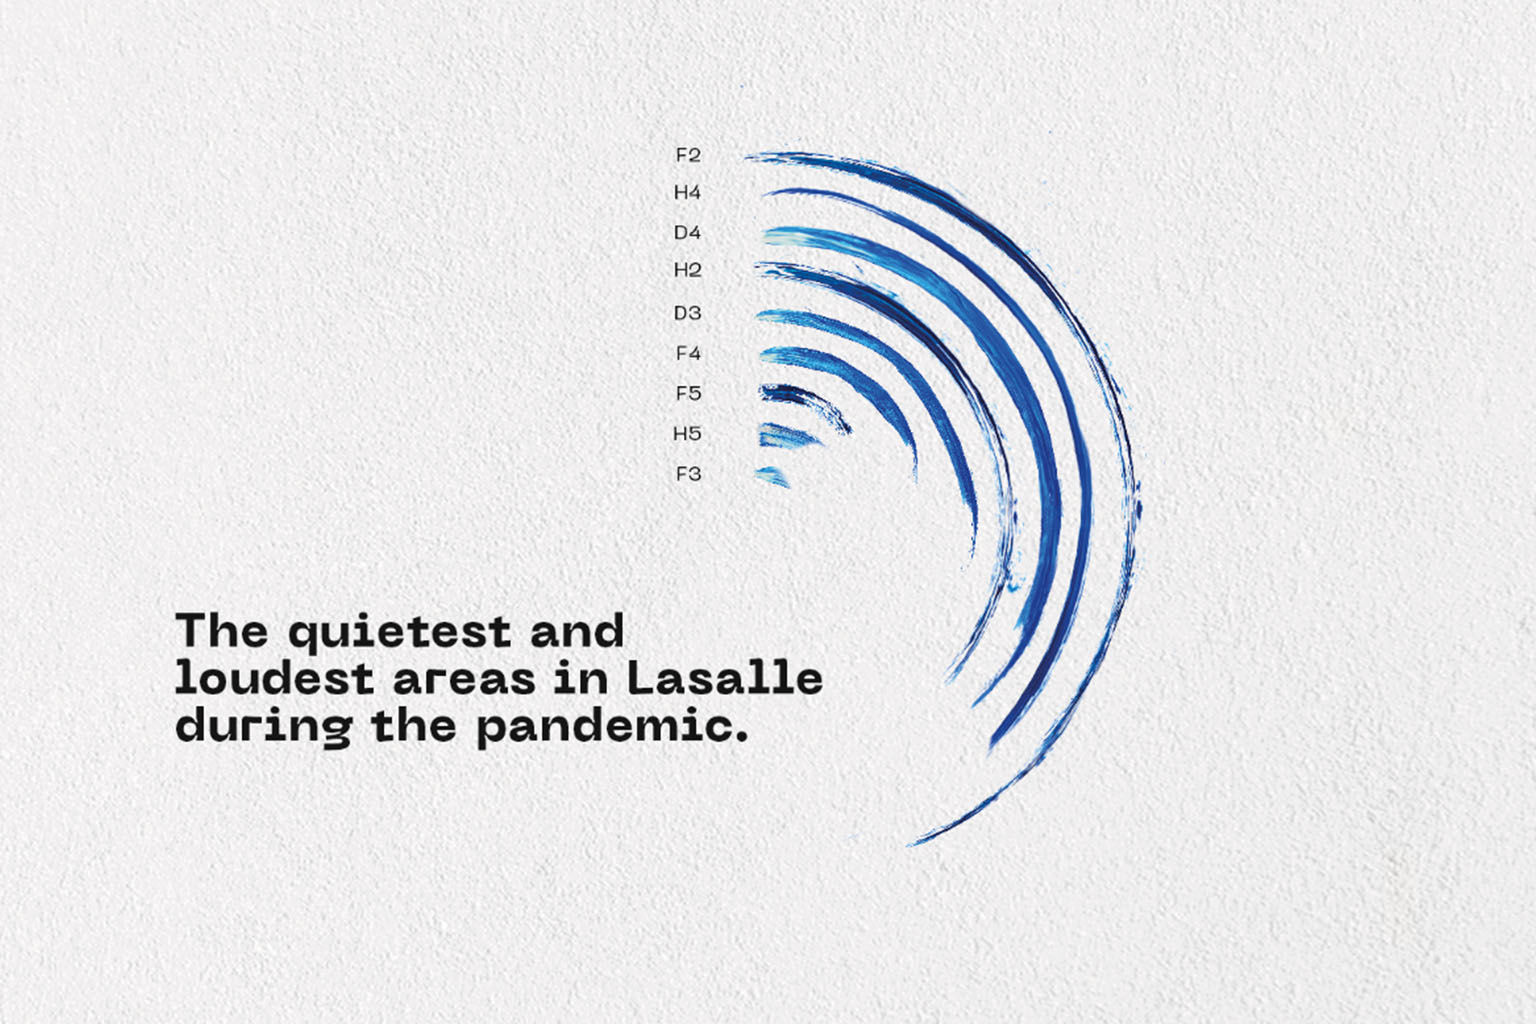
Taking a step further would be the Radial Bar chart that plots the data points onto a polar coordinate system, instead of a flat cartesian system.
The function remains the same but it looks visually on brand with the nature of my project. The way the bars extend to the loudest location creates an illusion of a sound wave. The coded visualisation allows users to toggle between two different modes—loudest and quietest data. Although the shifts in locations aren’t obvious, I believe it is still important to note that while some areas may record louder sounds, they may also be a spot with the quietest ambiance for the majority of the recorded period.
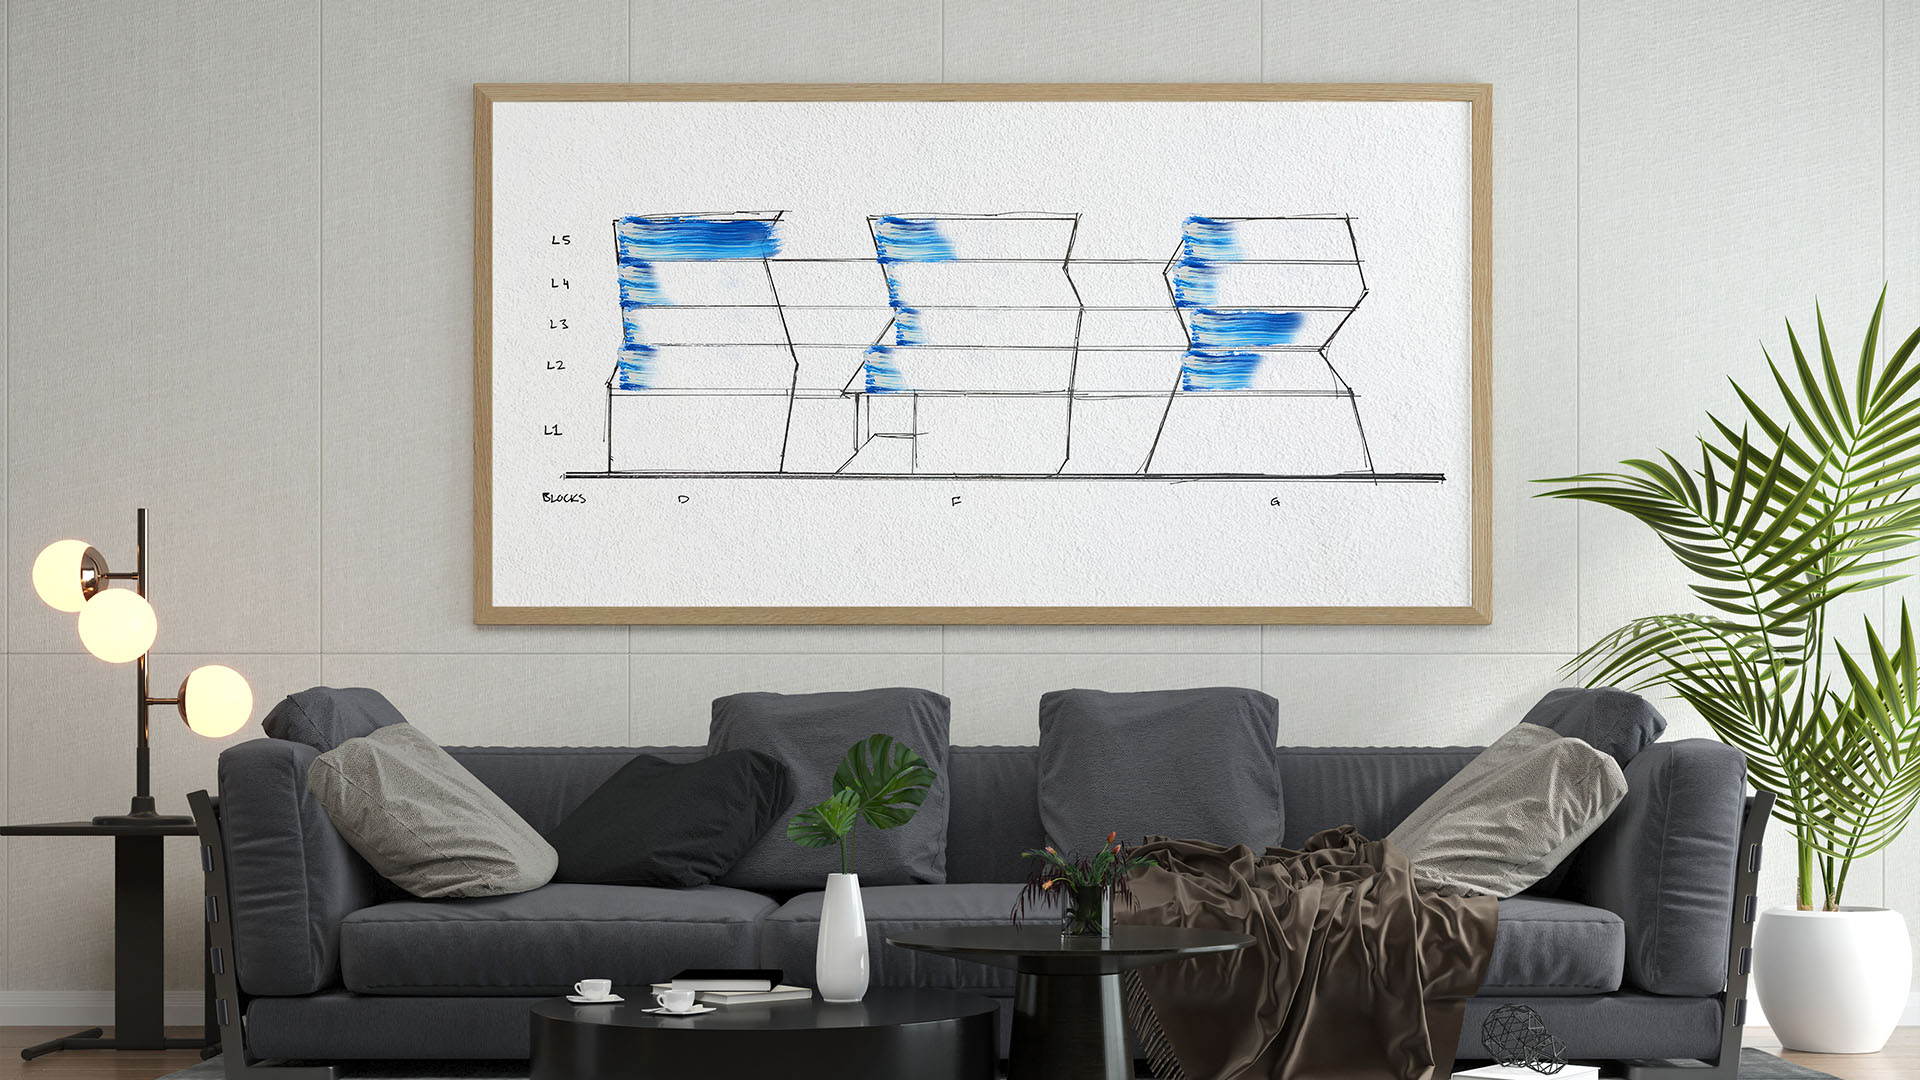
In the later part of the project, I decided to create 'paintings' to visualise the data in a more fitting display.

Findings
As a whole, my data collection and location scouting has proven that Lasalle as an art college has very low activity. Although the collection samples varied between different schools of design, the general finding is that all the blocks maintained an almost negligible ambient noise level, with only certain areas peaking slightly higher than the rest. The school of spatial and product design with their use of hand tools is one of the schools to have shown a higher ambient noise level during my data collection.
Having said that, the School of Design Communication had the highest level of sound recorded (reasons explained in insights segment). From the graph, we can note that the loudest location would be Block D Level 5. The lowest loud sound recorded in a location was in Block F Level 3. When we toggle to view the quietest locations, Block D Level 5 remains at the top, however there are some shifts down the chart. For example, we note that Block F Level 3 did not record the quietest sound as one might have thought. Taking its place is a level above, Block F Level 4.

Insights
The low noise levels could mean that the school is viewing little student activity. However, I must add that the time and date of the data collection may be a factor not considered here. Common sitting areas are mostly empty while consistent noises include doors left ajar and occasional footsteps. It might also be interesting to note that there were no noise trends specific to a block (i.e. block D can’t be seen as the loudest block even if Level 5 had the highest amount of noise recorded).
Although Block D Level 5 had the highest recorded sound, it could have been fate that a student decided to have a phone conversation within that space at the time of recording.


Conclusion
In conclusion, the typical correlation between art schools and high energy cannot be proven here based on the data collected. The relationship between the type of schools and noise levels might still be relevant as small bits of activity can be seen from the data. Generally speaking, the life of an art school is not as active as one might guess. Correlating these findings to the research study, I would agree that my personal experience would have gained from a more active school climate.
References
- Maxwell, Sophie et al. "The Impact Of School Climate And School Identification On Academic Achievement: Multilevel Modeling With Student And Teacher Data". Frontiers In Psychology, vol 8, 2017. Frontiers Media SA,https://doi.org/10.3389/fpsyg.2017.02069.
- "What Is School Climate And Why Is It Important? - National School Climate Centre".. National School Climate Centre, 2021.https://schoolclimate.org/school-climate/.
